
Linking what the audience reads to what advertisers buy
A weekly view of audience by section next to ad sell through, so editors and sales can see the same picture and act together.
What the numbers say
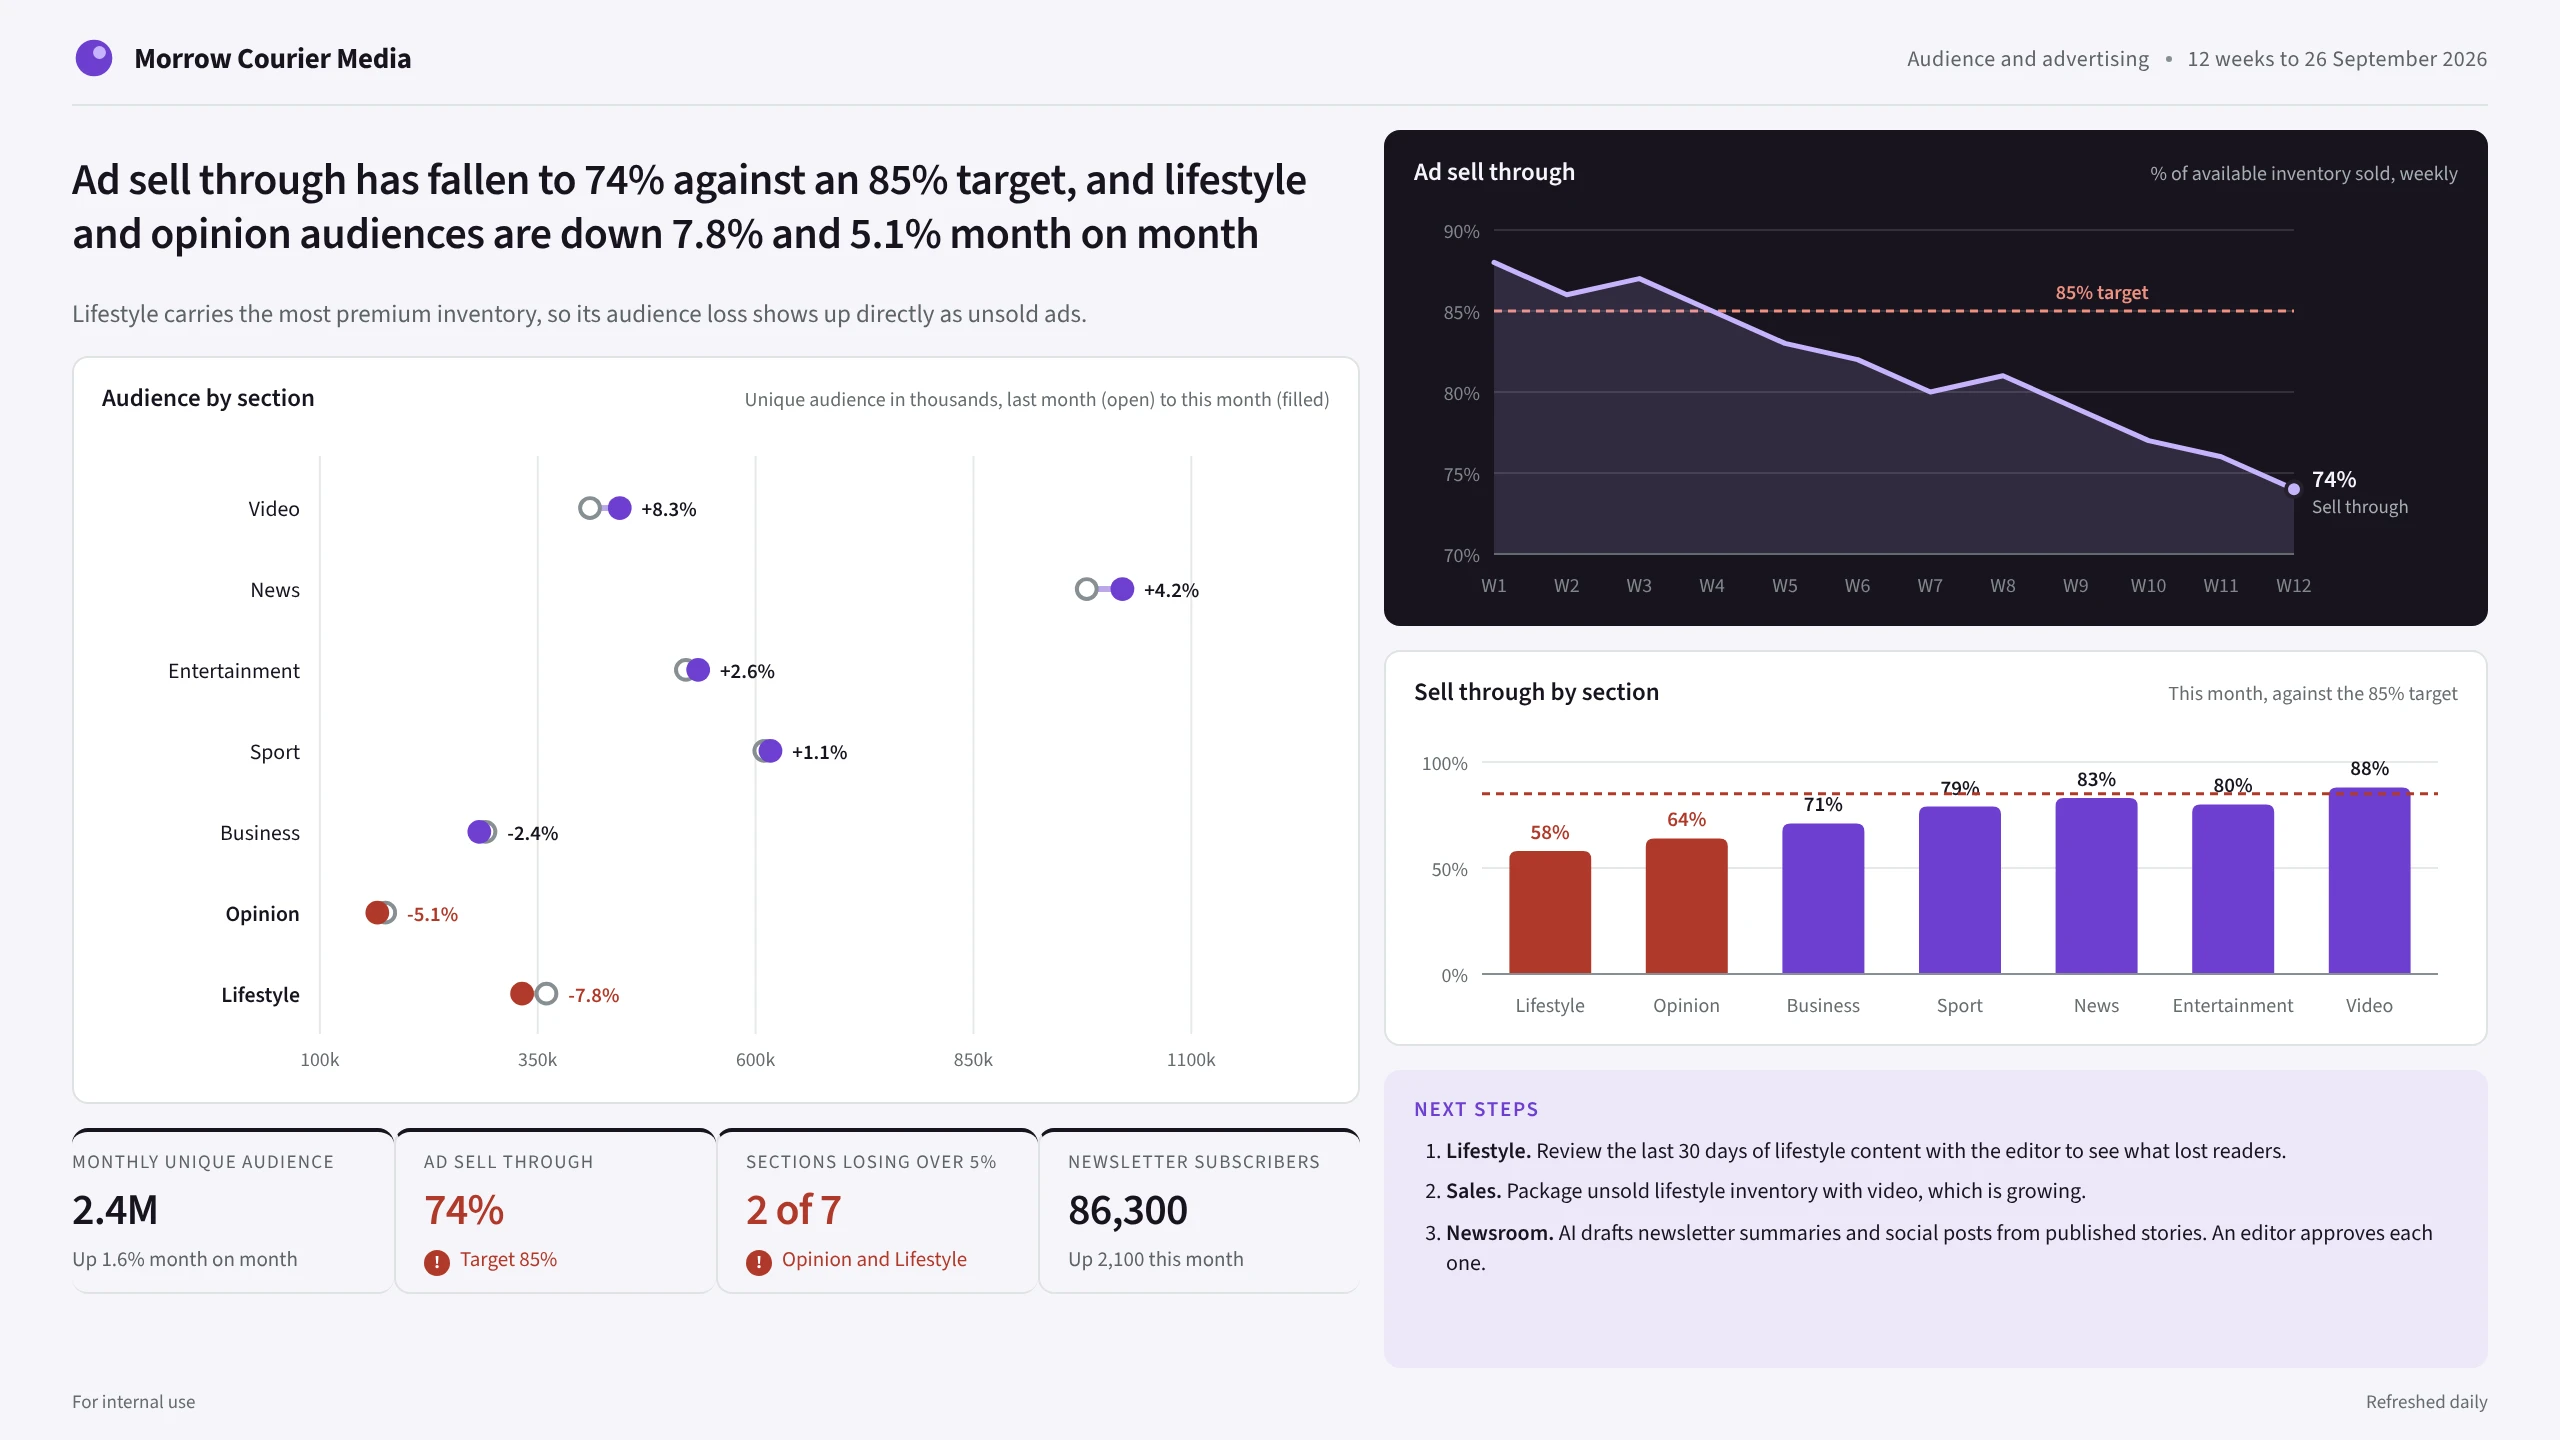
Lifestyle carries the most premium inventory, so its audience loss shows up directly as unsold ads.
The problem
A publisher's editorial team watched audience numbers and its sales team watched inventory, in separate tools. When ad sell through dropped, nobody connected it to the sections losing readers.
How FDX uses it
Connect the data. We connect web analytics, the ad server and the subscriber list into one model, refreshed daily.
Draft, then approve. AI drafts newsletter summaries, social posts and sales reports. Editors and account managers approve what goes out.
Keep it private. Subscriber details are masked before any AI model sees them, and the data is not used for training.
Next steps it points to
- LifestyleReview the last 30 days of lifestyle content with the editor to see what lost readers.
- SalesPackage unsold lifestyle inventory with video, which is growing.
- NewsroomAI drafts newsletter summaries and social posts from published stories. An editor approves each one.
SampleSample case study. The company is made up and the data is sample data, not real data.
Next exampleArts & cultureFilling programs and keeping members coming back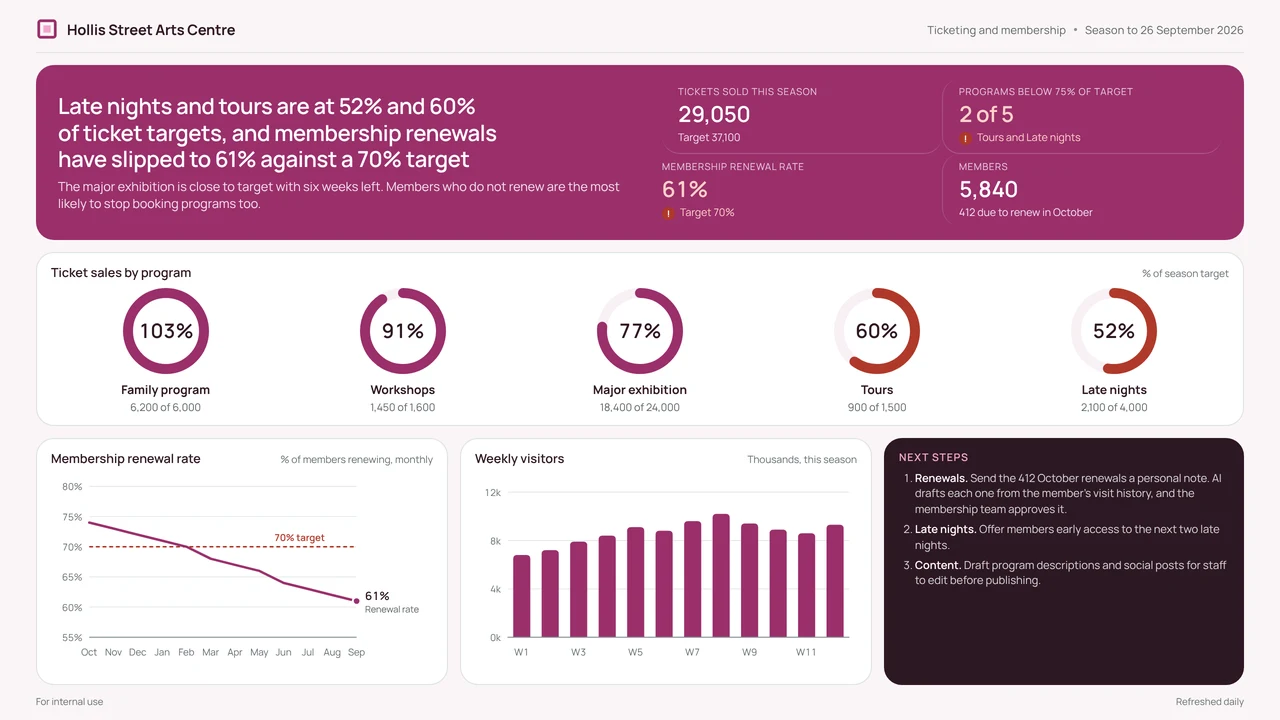
The dashboard is one part of the work.
It gives the team one trusted view of the numbers. The bigger gain is AI working from that same data to draft the follow ups, with a person approving every step.
When AI drafts from your data, personal details are masked before the model sees them. Onshore hosting is available, and your data is not used for training.